
Increasingly websites are not only being used for marketing services or campaigns, but actually delivering them too. That means if we don’t pay attention to our web analytics, we’re missing a huge chunk of our impact.
I’m going to look at three little used features that make for great reporting with Google Analytics.
Filters: Trusting the stats
One thing you might forget is just how much of your web traffic is coming from staff at your charity. Especially if people have it set as their homepage, creating lots of three second visits with 100% bounce rates!
You can easily screen this out.
Edit your profile settings (using the Edit link on the page you see before getting to your site’s dashboard) and click Add Filter.
Select “Exclude traffic from the IP addresses that are equal to” and type your office IP address in the box. If you don’t know your IP address, then just visit whatsmyip.org and type the big number you see at the top into your filter.
From that point on you can be confident that your data is accurate as you start to generate more insights from it.
Google Analytics Help: Filtering Your IP
Segments: Measuring brand awareness
There are two kinds of visitor to your website that behave in very different ways.
Branded Traffic: Branded traffic comes from people searching for your organisation name, acronymn, a campaign name, or your web address. These visitors already know at least a little about you.
Unbranded Traffic: These are people searching for a cause, a subject or a task. These people may well be new to your organisation.
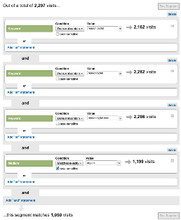
We can use a feature called “advanced segments” to look at each separately, and get an idea how our brand or campaign awareness is changing over time.
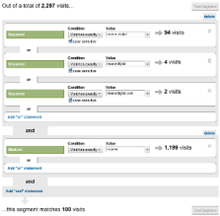
Set up two advanced segments as shown above, dragging the coloured blocks over from the bar on the left into the slots on the right. Include variations of your organisation name such as acronymns and your web address.
To use the segments just click the Advanced Segments drop down at the top of the screen and check the box. Right away you’ll see on your visit graph what percentage of your traffic comes from that segment and how their behaviour differs from the baseline average.
If this graph spikes up then your brand awareness has spiked that month – and you can tell as a percentage by just how much. Pretty neat, huh?
You can use the same technique to calculate social media ROI by looking at refers from social media sites, rather than keywords from search.
Google Analytics Help: Setting Up Advanced Segment
Goals: Measuring and improving results
Getting more visits, pageviews and tweets is great – but it’s the end results we’re really after. The visits to your site are just the raw material that you hope to convert into petition signatures, service users, volunteers or donations.
We can track these results in Google Analytics by using a feature called ‘Goals’.
To add a new goal go to your Edit Profile screen, as with filters, and click ‘Add Goal’ in the first goal set.
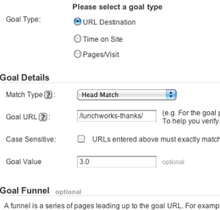
The most useful goal is URL Destination. Every time someone reaches a particular page it will trigger the goal, and you’ll be able to see which pages they visited on their way, and where they came from in the first place.
To track a donation, simply get the URL for your donation thank you page (e.g. www.example.com/thanks.php) and set it as a goal.
If you know, on average, how much each donation is worth you can enter it into the Goal Value field to have your goals represented in pounds and pence in your reports.
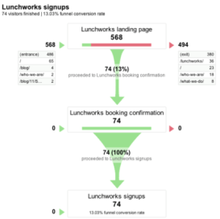
If your process has multiple steps, as most processes do, you can input each step’s URL into the Goal Funnel boxes. For example if people can buy publications then they might have to go from the basket, to the customer details page, to the payment page.
You’ll then be able to visualise this goal as a funnel, seeing how many people dropped out at each stage. This gives you a valuable insight into a quick fix that could seriously up your website’s conversion rate.
Google Analytics Help: Setting up Goals and Funnel
Conclusion
This is only a fraction of what you can do with Google Analytics. Yet just making a start with these three tips will give you a much more accurate, much more informative view of your website’s impact.
All of these features can be used without needing any technical support or changes to your site – you just need to tweak a few settings in the Google Analytics interface. So what are you waiting for?